The Retrap Adults for Survival (RAS) scheme is a national standardised ringing programme within the BTO Ringing Scheme that has been running since 1998. Ringers aim to catch or re-sight at least 30 adult birds of a single species in a study area during the breeding season. The study area is well defined and the ringer is aiming to record the vast majority of the adults.
In 2014 there were over 180 projects throughout Britain and Ireland on species as diverse as House Sparrow, Moorhen, Pied Flycatcher and Manx Shearwater.
RAS is used to give adult survival rates and is particularly useful for those species not widely covered by CES (Constant Effort Sites).
The Retrapping Adults for Survival Scheme is supported by a partnership between the British Trust for Ornithology (BTO ) and the Joint Nature Conservation Committee (JNCC) (on behalf of: Council for Nature Conservation and the Countryside, Natural Resources Wales, Natural England and Scottish Natural Heritage). It is also part of the BTO Ringing Scheme which is funded by the BTO /JNCC Partnership, The National Parks and Wildlife Service (Ireland) and the ringers themselves.
EDRG has been involved in a number of RAS projects since 1998 and is currently involved in running four. Below is some detail about these four and others that were run but have now been curtailed.
Pied Flycatcher (RAS 87) since 1998
Little Ringed Plover (RAS 96) since 1998
House Martin (RAS 392) since 2016
Mute Swan (RAS 400) since 2018
Previous ones have included Sand Martin curtailed due to colony decline, Wood Warbler curtailed due to a steep decline in population and 1st Hoiuse Martin site curtailed due to colony decline.
The two newer RAS projects for House Martin (RAS 392) and Mute Swan, (RAS 400) have yet to generate sufficient data for the BTO to run an analysis.
Below, is data, from the BTO, of data from three of our projects.
HOUSE MARTIN (RAS 50) SHAROW, NEAR RIPON


There are three active projects for House Martin. The national trend is generated from three historical and two current projects. The quality of the national trend is considered to be ‘Good’. The survival rate has declined sharply in the past six years and the long-term results (1994-2014) show a declining trend for this species, matching the drop in abundance exhibited by CBC/BBS results. RAS survival rates have been shown to correlate positively with periods of drought in West Africa but this does not account for the overall population decline.
The trend for your historical project shows that your House Martin population was reasonably stable over the long term. The larger fluctuation in the data, and the associated wide confidence limits, appear to reflect the years when there were fewer birds on site and therefore your numbers were reduced.
EDRG PROJECT TREND

NATIONAL TREND

Summary Results
Estimate of average adult survival across all projects:
Male annual adult survival rate: 29% : Female annual adult survival rate: 30%
Estimate of average adult survival from your project:
Male annual adult survival rate: 32% : Female annual adult survival rate: 16%
Estimate of your average annual recapture probability:
Male recapture probability: 57% : Female recapture probability: 42%
The graphs end at 2007; this is because the RAS programmes calculate survival between years, so the last point is the survival from 2007 to 2008.
The graphs show “Apparent Adult Survival”, defined as the probability that an adult bird alive in the previous year survives and returns to the study area. The analysis accounts for the fact that birds which are present may not be seen every season, but birds permanently emigrating from the study area will be presumed dead, thus the true survival rate may be slightly higher than the figures presented here.
The dotted lines show the upper and lower 95% confidence limits around the average estimate (solid line and points). The closer these lines are to the solid line, the more confidence we have in the accuracy of the survival rates.
SAND MARTIN (RAS 51) RIPON PARKS SOUTH


EDRG’s is one of 15 active projects for Sand Martin. The national trend is generated from 13 historical and seven current projects. The quality of the national trend is considered to be ‘Good’. Sand Martin survival rates have fluctuated since the early 1990s and after reaching the highest level since 1990 in 2014, exhibited a decline between 2014 and 2015. RAS survival rates have been shown to correlate positively with periods of drought in West Africa.
Although your results have fluctuated over the years, there appears to be a small increase in the survival rate for our population. The large confidence limits around the trend in 2012 are the result of having no data in that year after the colony was washed out (and therefore not retrapping any of the previous year’s birds or ringing any new birds to be retrapped in 2009). Across all active projects, the recapture probability is higher for females than for males; the range is between 10% and 49% (females).
EDRG PROJECT TREND

NATIONAL TREND

Summary Results
Estimate of average adult survival across all projects:
Male annual adult survival rate: 38% : Female annual adult survival rate: 33%
Estimate of average adult survival from EDRG project:
Male annual adult survival rate: 28% : Female annual adult survival rate: 32%
Estimate of EDRG average annual recapture probability:
Male recapture probability: 21% : Female recapture probability: 28%
Notes
* The graphs end at 2014; this is because the RAS programmes calculate survival between years, so the last point is the survival from 2014 to 2015.
* The graphs show “Apparent Adult Survival”, defined as the probability that an adult bird alive in the previous year survives and returns to the study area. The analysis accounts for the fact that birds which are present may not be seen every season, but birds permanently emigrating from the study area will be presumed dead, thus the true survival rate may be slightly higher than the figures presented here.
* The dotted lines show the upper and lower 95% Confidence Limits around the average estimate (solid line and points). The closer these lines are to the solid line, the more confidence we have in the accuracy of the survival rates.
This RAS concluded in 2016 because the colony is almost defunct.
PIED FLYCATCHER (RAS 87) WESTWOOD AND STRID WOOD


EDRG’s project is one of 23 active projects for Pied Flycatcher. The national trend is generated from seven historical and 19 current projects. The quality of the national trend is considered to be ‘Good’. The long-term trend (1980-2015) has remained stable at around 40% since 1980. Nationally, the abundance trend shows a stark decline since the mid-1990s but this levelled off in the mid- to late-2000s; the cause of the decline is unknown.
EDRG’s trend shows a slight long-term increase in the survival rate for our Pied Flycatcher population. The blip in the trend between 2005 and 2007 is due to the modelling programmes being unable to calculate accurate survival rates from the small number of adult-adult retraps associated with your project at that time. Across all of the active projects, the recapture probability is higher for females than for males; the range is between 32% and 85% (females).
EDRG PROJECT TREND
NATIONAL TREND

Summary Results
Estimate of average adult survival across all projects:
Male annual adult survival rate: 43% : Female annual adult survival rate: 40%
Estimate of average adult survival from EDRG project:
Male annual adult survival rate: 45% : Female annual adult survival rate: 42%
Estimate of EDRG average annual recapture probability:
Male recapture probability: 68% : Female recapture probability: 79%
Notes
* The graphs end at 2014; this is because the RAS programmes calculate survival between years, so the last point is the survival from 2014 to 2015.
* The graphs show “Apparent Adult Survival”, defined as the probability that an adult bird alive in the previous year survives and returns to the study area. The analysis accounts for the fact that birds which are present may not be seen every season, but birds permanently emigrating from the study area will be presumed dead, thus the true survival rate may be slightly higher than the figures presented here.
* The dotted lines show the upper and lower 95% Confidence Limits around the average estimate (solid line and points). The closer these lines are to the solid line, the more confidence we have in the accuracy of the survival rates.
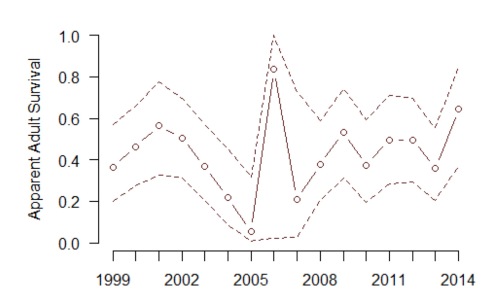
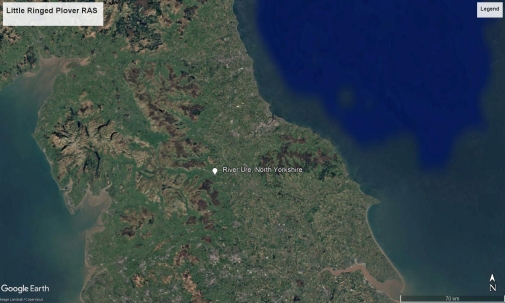
LITTLE RINGED PLOVER (RAS 96) RIVER URE


EDRG’s project is the only active project for Little Ringed Plover. The national trend is generated from our project alone. The quality of the national trend is considered to be ‘Uncertain’, probably due to the small sample sizes available for analysis.
The modelling programmes were unable to calculate a survival rate for your population for 2012‒13, hence it is showing as 100% for that year; this is likely to be due to the very small number of birds ringed in 2012. Although fluctuating, the long-term trend suggests that your population is relatively stable. The nests and chicks were photographed with the appropriate Schedule 1 licence.
EDRG AND NATIONAL PROJECT TREND

Summary Results
Estimate of average adult survival across all projects:
Male annual adult survival rate: 59% : Female annual adult survival rate: 43%
Estimate of average adult survival from EDRG project:
Male annual adult survival rate: 59% : Female annual adult survival rate: 43%
Estimate of EDRG average annual recapture probability:
Male recapture probability: 53% : Female recapture probability: 37%
Notes
* The graphs end at 2014; this is because the RAS programmes calculate survival between years, so the last point is the survival from 2014 to 2015.
* The graphs show “Apparent Adult Survival”, defined as the probability that an adult bird alive in the previous year survives and returns to the study area. The analysis accounts for the fact that birds which are present may not be seen every season, but birds permanently emigrating from the study area will be presumed dead, thus the true survival rate may be slightly higher than the figures presented here.
* The dotted lines show the upper and lower 95% Confidence Limits around the average estimate (solid line and points). The closer these lines are to the solid line, the more confidence we have in the accuracy of the survival rates.
